Friday, December 15, 2017

Project Blog: Charity Fair - 12/17


Summary
Charity Fair is the most complex project of the year because it stretches out to every class. Students had to complete tasks and learn new skills in each class, that relates to their product or charity. In social studies, students researched and learned information about the organization they support. Including the charity's mission, story, and how many they have affected on their journey. In math class, students learned the profit they would make by selling their product, the price of their product, and how much it would cost to produce their product. In addition, students learned the charity statistics, such as how much money the charity makes per year and what percentage goes to the cause. In science, students learned the mode of transportation to ship each material that contributes to the creation of the product. In engineering, students learned how to create an instructable and backboard for the project. Lastly in language arts, students learned how to put together an ignite presentation to efficiently advertise their charity in exactly 2 minutes.


Backward-Looking
During this year's annual Charity Fair, students were put into groups of 2 to 3 among the peers in their class. The priority of Charity Fair is to find a charity or organization that you truly care about and sell products to raise money for that charity. To find the ideal charity, each group had to research the different organizations that supports their topic in social studies. Based on observing the charity's ratings and mission, students were able to make a decision about what charity best suites their outlook. This leads to the final choice of the certain charity the group is willing to support/advertise throughout this project. Next, groups had to decide what product they are going to sell in order to raise money for charity. This product has to have some correlation to the group's charity. Once the product is approved, students had to create a Cost & Profit and Statistics document in math class. In addition, students created a google map in science alongside a Carbon Footprint document. Meanwhile in engineering, students had to make an online instructable that would be pasted on a backboard that is also created in that class. To finish it of, students created a quick ignite presentation containing only photos, to influence students/teachers to vote for their charity.

Inward-Looking
Going into this project, I had many standards for myself as well as my group. Since I am currently in 8th grade and this is my last year of Charity Fair, I knew exactly what to expect. So I had many expectations and goals to hopefully accomplish. The first expectation was for my group to choose a charity that we really care for. The main reason for Charity Fair is to raise money for a worthy cause. It is very important that the charity you are advertising speaks volumes to you and that you are passionate about the topic. Another expectation was for my group to get work done efficiently and on time. After years of doing the same type of work for this project, we should know how the assignments are expected to be completed and what to do for them. In addition, we should know the amount of work that needs to be done for Charity Fair, therefore we should be able to split the work up equally so that it is turned in on time. The last expectation I had was for each group member to memorize their lines for the ignite presentation. At our age, we should be setting a good example to the younger students presenting. It is unprofessional to be reading from a script.

Outward-Looking
The one thing I would like people to notice or take away from my group's project is how hard we have worked on it. It has taken so much time and effort to complete each assignment for Charity Fair. There were several different tasks that needed to be done at the same time and for different classes. The amount of work for this project was overwhelming and took dedication to complete. In addition, to create the products we sold at Charity Fair, my group had to stay extra hours at each other's houses to make each item perfect. My group sold gingerbread house kits so it definitely took a while to create each component of the kit. The gingerbread was very difficult to bake because the shapes had to be cut neatly and the dough needed to be at the right thickness or else the cookies would break too easily. It took several tries to get the outcome that we wanted. The same trial and error situation happened with the icing as it needed to be the right ratio of ingredients in order to create a consistency that was strong enough to hold the house, yet would pipe with ease.

Forward-Looking
Looking at the final outcome of this year's Charity Fair, I would only like to change one thing if I had the change to do this project over again. This one change would be to create more of my group's product. In the past, it always took a good amount of time to sell all of my group's product. However this year it only took the first five minutes for my group to sell out. Once all of the products were gone, there was nothing to sell and no more money could be raised from my group's stand. This quick sell out is due to the mistake of making only ten products. Although each item was very difficult to create because of the complexity of each component put into the product, I still believe that we could have at least made a few more products. Therefore making fifteen in total. This would give others who were looking forward to our product, a chance to buy one. It would also allow my group to raise more money for the chosen charity and contribute to its donations.

Sunday, December 3, 2017

Carbon Footprint 12/3

https://housebuyers4u.co.uk/wp-content/uploads/2016/01/co2.jpg
A carbon footprint is historically defined as the total set of greenhouse gas emissions caused by an individual, event, organisation, or product, expressed as carbon dioxide equivalent. A simplified definition of carbon footprint is the amount of carbon dioxide that is released into the atmosphere when certain items are shipped around the world. Shipping these items helps companies gather the materials they need in order to create products that are sold in stores today. It is important for companies to know what their carbon footprint is because depending on how far the items are shipped, it could effect the environment crucially. In addition, the length of how far the items travel can determine how much money it costs to ship the items. To calculate the carbon footprint, you have to find out how far it takes each material to ship from the manufacturer's to the factory where your product is built or sold. First, you have to consider what possible mode of transport should be used to ship each material. If the manufacturer is in the same country then a truck should be used. If the manufacturer is in the same continent then a train should be used. If the manufacturer is in a different continent then an airplane should be used. Then you find out how many miles each item travels and convert those miles to the amount of CO2 that is released depending on the mode of transport.

S&EP - SP2: Developing and using models

I constructed physical, mental or conceptual models to represent and understand phenomena when I created a google map with my group to represent the location of each material needed to create our product for Charity Fair. I used models to explain and predict behaviors of systems, or test a design as I marked the locations of the manufacturers or where each material was made. Then we marked the location of the retailer or where we bought each material. Next, we connected the manufacturers to the retailer with the line tool as we decided the possible mode of transport for each material. Lastly, we found out how many miles the materials traveled and converted the amount of miles to the amount of CO2 that would be released when each material is shipped. I refined/rebuild my model as I learned that each location needed to be marked with their own individual icon.

Tuesday, October 31, 2017

Common Descent 11/5

https://upload.wikimedia.org/wikipedia/commons/1/14/Hadrosaur-tree-v4.jpg
Common Descent describes how, in evolutionary biology, a group of organisms share a most recent common ancestor. Charles Darwin came up with this theory to explain how all species have evolved from one species, over time. Scientists can find out if organisms of different species have a common ancestor by looking at their homologous structure. By comparing the similarities and differences in the bones of organisms, you are able to make connections between the structures of the individual species. Darwin's discovery is supported by Embryological evidence. Embryological evidence proves that all animals developed from a common ancestor. An embryo is the early stages of development in a multicellular organism. Through observation of several organisms, you are able to distinctly see that the embryos of each species all look almost identical.

S&EP - SP1: Asking questions and defining problems

I formulate testable questions when I observed the document that we were required to do in class, and read what questions I needed to answer in order to complete this document. I established what is already known about common descent and the theory that all organisms originated/evolved from a common ancestor by writing down all of the information I found when investigating the provided website that correlated with the questions. I determine what questions have yet to be answered when I went over the document and saw which questions I haven't answered or found the information for. I defined constraints and specifications for a solution as I saw that some questions required information that wasn't in the provided website. I had to answer those questions with the knowledge I already had.

Sunday, October 29, 2017

Elephant Adaptations 10/29


http://s4.thingpic.com/images/54/uQLiTKXMXKApPTwDyG8rez9L.jpeg
Throughout generations, elephants have grown to help their species be more fit in the environments they are native to. In order to live the savannas of Africa and Asia, elephants have adapted traits to help them thrive in these harsh conditions. The three main features of an elephant that are key to their survival in the savanna are their trunk, tusks, and gigantic ears. An elephant's trunk is a (at most) 7 foot long appendage that contains 40,000 muscles. The trunk can help elephants drink water by sucking up water and spraying it into the elephant's mouth given that elephants aren't able to bend down to reach the water source. In addition, the trunk can spray water onto the elephant's body to keep them cool in the heat or can fling dirt over the elephant's back to protect from the sun and biting insects. To help elephants obtain and eat their food, the trunk can pick up food, gather food, and grab food from higher areas such as tree branches. An elephant's tusks can develop up to 11 feet long to help them dig for water in times of drought, strip bark from trees to eat, lift objects, fight, and defend. The tusks also protect the sensitive trunk. Elephants have large ears that have an extensive supply of blood vessels so they can flap their ears to create air currents across the ears. These air currents reduce excess body heat.

S&EP - SP2: Developing and using models

I constructed physical, mental or conceptual models to represent and understand phenomena when I created a cartoon comic strip to explain the adaptations that elephants developed to survive in the savanna. I used models to explain and predict behaviors of systems, or test a design as I wrote a story line that follows a tour group driving through the savanna to explain elephant adaptations. Along their journey throughout the savanna, this tour group learns about the different parts of the elephants body that helps it survive on a daily basis. I refined/rebuild my model as I learned about more of the different abilities that the trunk, tusks, and ears of the elephant does to help the elephant be more fit for the savanna environment.

Friday, October 20, 2017

Natural Selection - 10/20

https://involutedgenealogies.files.wordpress.com/2015/03/lulz.jpg
Natural Selection is the process where organisms better adapted to their environment tend to survive and produce more offspring. However, the organisms that are unfit for the environment struggle and don't survive. To put the definition more simply, Natural Selection is known as "survival of the fittest". The theory of Natural Selection was first fully expounded by Charles Darwin and is now believed to be the main process that brings about evolution. This process happens when there is a variation of traits in the population. Therefore, the traits that have most advantage in the environment would thrive while the other unfit traits would die out and disappear in the population. This action would result in the population of species adapting to their environment as the environment changes overtime. An example of Natural Selection is when there are green and brown beetles in a population. Over generations, the green beetle trait dies out and disappears in the population. The reason being is that the green trait is not fit for the environment because the green beetles are not able to camouflage in the dirt. The brown beetles however, are able to camouflage in the dirt. The brown color trait becomes more common in the population because the brown beetles are able to survive/thrive and the brown trait has more advantages in the environment.

S&EP - SP7: Engaging in argument through evidence

I use evidence to defend my explanation. I answered and filled out a guided notes document about the theory of Natural Selection. When completing this document, I provided a couple of websites about Natural Selection as evidence. These websites were assigned to the guided notes and I had to use these resources in correlation to the questions on the document. I formulated evidence based on solid data when I stated that Natural Selection allows species to adapt to their environment and evolve. To support this statement I used the fact that throughout the process of Natural Selection, the traits with the most advantage in an environment survive and thrive while the trait with the least advantage die out and disappear from a population, as evidence. This proves that as the environment is changing, the phenotype of the species in a population are changing to, in order to adapt to their environment. I examined my own understanding in light of the evidence. I used to think that the process of Natural Selection was random. However, because of completing the guided notes activity and answering the questions on the document, now I think that Natural Selection is the process in which random evolutionary changes are election in nature in a consistently, orderly non-random way. This is because through the process of common descent with modification, new traits are randomly produced. Nature then carefully decides which of those traits to keep or which of those traits get to survive. Positive changes add up over multiple generations and negative traits are quickly discarded.

Saturday, October 14, 2017

Genetic Drift - 10/15

http://www.oceangrownseeds.com/wp-content/uploads/genetic-drift-2-300x208.jpg
Genetic Drift is a mechanism of evolution in which allele frequencies of a population change over generations due to chance. Genetic Drift is a random process that can lead to large changes in populations over a short period of time. It is when important genes are not passed on to the offspring. There are two different ways Genetic Drift can occur. These two major types of Genetic Drift are the bottleneck effect and the founder effect. The bottleneck effect occurs when there is a disaster of some sort (such as a natural disaster or predator) that reduces a population of species into a small handful of species. This small handful of species rarely represents the actual genetic makeup of the initial population. This leaves smaller variation among the surviving individuals. An example of the bottleneck effect is when there is a population of beetles. A predator invades the territory of this beetle population and wipes out part of the population. This means that the traits in the genetic makeup of the beetle population that was killed, is gone. Therefore, these lost traits won't be passed on to the offspring of next generations. The founder effect is the loss of genetic variation that occurs when a new population is established by a very small number of individuals from a larger population. An example of the founders effect is when a small population of beetles left to find new land. A variety of these beetles left so their genes and traits are taken away from the original population. In result, these traits won't be passed to offspring in next generations of the original population.

S&EP - SP4: Analyzing and interpreting data

I used a table or spreadsheet to display and analyze data while performing a lab in class. I recognized patterns in data and see relationships between variables. For example I observed that after the Genetic Drift, all traits in the original population of M&Ms or colored candius were changed. No amount of traits or colors in the original population stayed the same after the Genetic Drift. I revised my initial hypothesis when the data doesn’t support it. My original hypothesis was that some of the traits in the original population of the colored candius would be completely lost while some traits would stay the same amount after the Genetic Drift. But my new hypothesis is that all traits in the original population of the colored candius will change after the Genetic Drift.

Friday, October 6, 2017

Project Blog - 10/8


Summary:
The Geologic Time Scale is a system of chronological dating that relates geological strata to time. This system is used by geologists, paleontologists, and other Earth scientists to describe the timing and relationships of events that have occurred during Earth's history. Our assignment was to create a interactive display that shows information about the Geologic Time Scale. In order to do this, the class was separated into groups of three or four. Each person of the group is responsible for researching one era of the Geologic Time Scale, including the Precambrian era, the Paleozoic era, the Mesozoic era, and the Cenozoic era. Once each member has completed their research on each topic and aspect of their specific era, the group will collect all of their information and come up with a way to display their project. My group decided to put our project on a tri-fold poster. We would provide the information about each era on little flaps that people can flip up and read information on. Each flap contains a different fact about each era.

Backward-Looking:
The first step in completing this process is researching the information about each era in the Geologic Time Scale. The era I chose to research was the Precambrian era, which is the first era that occurred in the history of Earth. After each member was assigned a specific era, we needed to research several different topics about the eras. This included, the periods in which the era is separated in, what the climate was like during this time, the geological aspects of the era (such as the oceans, mountains, volcanoes, etc.), the continental positioning during this era, the plants that thrived, and the animals that walked the Earth. Once each member of my group completed their research, we started brainstorming ideas on the actual project display. We found that the most cost efficient way of creating a display was to use one of the tri-folds that were provided by our teacher. We decorated the tri-fold by dividing it into four sections for each era. Then we painted each section a color that represented each era. We painted the Precambrian red, the Paleozoic blue, the Mesozoic brown, and the Cenozoic green. Next we wrote the titles for each era on panels that would pop out on the tri-fold. In addition, we decided to make our project interactive by cutting out flaps of color coordinated construction paper and write facts about each era on the corresponding color of construction paper. For final touches, we glued on images/drawings of the plants and animals on the section of the era where they occurred. This step helped make the display less more full and colorful.

Inward-Looking:
When creating this piece of work, I set many goals for my group. An important part of collaborating on a project is to be organized. Our way of organization was planning on what needed to be done and when things needed to be done. The main objective/goal of the project was for my group to put together an interactive display that holds information on each era of the Geologic Time Scale. As we began our research, the first goal was for each member of the team to complete at least the first three questions of the research worksheet on the first day, then finish the next three questions on the second day, and so on. This way we would all be done with the research on schedule with enough time to work on the display. The next goal was to find a way to display the information in a way where it would be interactive and appealing. After talking about potential ideas, we finally found the perfect way to display our project that fit with the design we wanted to present. Other goals my team set were to finish all of the painting of the tri-fold in one day, to finish the titles on the next day, to finish writing all of the information on the flaps on the day after, and to finalize the project by gluing everything on the tri-fold on the last day. As you can tell, our goals constantly changed throughout the process of this project. It all depended on what we accomplished and what we needed to accomplish.

Outward-Looking
If I were to give this project a grade, I would give it an A. I  believe that this piece of work should receive such a high grade because it has exceeded every standard of the project. When looking over the instructions for the project, I reviewed my project to make sure that my group followed all of the directions. The instructions to complete the project were to create an interactive artifact that accurately illustrates the eras that occur in the Earth’s history. Then we would get together with three other geologists which are the other members of your group, and compile all your work into one geologic time poster to present to the client which is the class. My group followed all of these steps in the process of creating our project. In addition, I believe that this grade is deserved because our project was original and creative. Nobody else in our class did their project the way we did ours. Our project was also very organized and appealing. The poster was organized into neat sections and we decorated the poster with a variety of colors, fonts, and colors. 

Forward-Looking;
If I had the chance to do this piece over again, I would only change one thing. In this revision, I would improve the lettering on the poster. I would make the lettering of the facts on each flap of information a little bigger. When presenting our poster to our "client", which is our class, the only criticism we received was that the facts were a bit difficult to read considering the size of the writing. When our clients read the information, they needed to look up close to the poster in order to be able to read the facts correctly. This is why the size of the writing is the only thing I would change about the poster. I believe that everything else on the poster was made to the best of my ability as well as my group's highest potential. So I wouldn't change anything else on the poster even if I had another chance to do the project again next time.

Monday, September 18, 2017

Era Report WAC - 9/22/17


       According to the Geologic Time Scale, there are four major eras in history that shape Earth as we know it today. The Precambrian era is the first era that occurred on Earth. This era covers almost 90% of Earth's entire history. The beginning of the Precambrian era started with the formation of Earth 4.6 billion years ago and ended at the first sign of complex life about 540 million years ago. This era is divided into three eons. This includes the Hadean eon, the Archean eon, and the Proterozoic eon. The Hadean eon started when the planet first began to form as the Earth's core was building. The solar system was constructing within a cloud of dust and gas, known as the solar nebula. The Archean eon was a time of continental building and showed the first stages of early life on Earth. At this time, the Earth's crust cooled enough that rocks and continental plates began to configure. The final eon apart of the Precambrian era is the Proterozoic eon. During the Proterozoic eon, life began to evolve into more complex organisms.

       Since the Earth was barely formed during the Precambrian era, there were little to no plants present during this time. According to the Penn State University department of science, Lichens are believed to have been the first fungi existing on Earth. A Lichen is a composite organism that arises from algae cyanobacteria living among filaments of multiple fungi in a symbiotic relationship. During the Proterozoic eon of the Precambrian era, Lichens teamed up with photosynthesizing organisms. The organisms that Lichens collaborated with, include cyanobacteria and green algae. Together these plants conceivably boosted oxygen levels in the atmosphere high enough for animals to develop skeletons, grow larger, and diversify.

        Toward the end of the Precambrian era, the first life formed. The first one-celled organisms formed during the Archean eon of the Precambrian era. Early evidence of life that was once living in the oceans of Earth were microscopic bacteria that were capable of photosynthesis. These one-celled organisms helped make the air and water around Earth become full of oxygen. Once there was plenty of oxygen in the atmosphere and in the ocean, new life could form. New varieties of bacteria began to harness the power of the sun through the biochemical process known as photosynthesis. This energy source ultimately lead to the creation of simple plants and opened the planet up to animal life. The Precambrian era ended with the emergence of complex, multi celled life forms. By the end of the Archean eon, the ocean floor was covered in a living mat of bacterial life.

         Scientists named this eon after the Greek god Hades, who ruled underworld. The surface of the Earth during most of the Hadean eon must have been like our image of the underworld. During the Hadean eon the Earth released tremendous amounts of heat as the Earth's core was forming, due to gravitational sinking. In fact the surface temperature of Earth at this time, was at 1200 degrees Celsius. Throughout the Archean eon, the outer covering of the Earth cooled and hardened into a crust. The hot molten leaked out at weak places in the crust, creating volcanoes. Water from comets and hydrated minerals condensed in the atmosphere and fell as torrential rain. This rainfall formed and filled oceans. The presence of micro organisms on Earth during this time, indicates that 4 billion years ago the Earth's surface temperature must have cooled to less than 100 degrees Celsius. Furthermore, the oceans must have been above 0 degrees Celsius. Therefore, the Earth's surface temperature was between 0 degrees Celsius and 100 degrees Celsius. These temperatures would have had to occur on Earth during this eon in order for these organisms to have lived.

           The basis of Earth's growth happened during the Precambrian era. There are three eons that make up the Precambrian era, including the Hadean, the Archean, and the Proterozoic. The Earth had just formed during the Hadean. At scorching temperatures, there were an abundance of radioactive elements and collisions with other solar system bodies. Approximately 70% of continental landmass was formed during the Archean eon. Huge pieces of crust began to move in different directions, called tectonic plates. This tectonic activity formed the first continent, Rhodinia, about 1.1 billion years ago. The modern-day continents South America, Australia, and Antarctica surrounded North America which was located in the middle. The Earth's crust started to cool down to between 0 degrees to 100 degrees Celsius for micro-organisms to live. However, the Proterozoic was the time when life actually evolved into more complex organisms. These organisms include bacteria life and multi celled organisms such as the Lichen fungi. All of these events that have occurred billions of years ago, are components that form the Earth we live on today.

Saturday, September 16, 2017

The Precambrian Era - 9/17/17

https://blogger.googleusercontent.com/img/b/R29vZ2xl/AVvXsEiCXqSBHuZ5Ti7Y-ktIlDh60PvyO5shbQBidGt5Fl2peHQ26Pb12jWVzGrC5zJ6Vo7_Scnn-CTNPK5sgVg2UQakv7Kwl0Ycv8D24elWj406Jr7IqPvn1IY8vvUPP-qOc1Y_JinlWHS5tgo/s1600/231A-Image+The+Beginning.jpg
According to the Geologic Time Scale, there are four major eras in history that shape Earth as we know it. The Precambrian Era is the first era that has occurred on Earth. This era covers almost 90% of the entire history of the Earth. The beginning of the Precambrian Era started with the formation of the Earth about 4.6 billion years ago and ends at the first sign of complex life about 540 million years ago. This era is divided into three eons, including the Hadean, the Archean, and the Proterozoic. The Hadean eon began when planet first began to form, about 4.6 billion years ago. Scientists named this eon after the Greek god Hades, who ruled underworld because during most of the Hadean period the surface of the Earth must have been like our image of the underworld. During this time, the Earth released tremendous amounts of heat (at a surface temperature of 1200 degrees Celsius) as the Earth's core was forming due to gravitational sinking. At the time of the Archean eon, the Earth's crust cooled enough that rocks and continental plates began to form. It was early in this eon that life first appeared on Earth. Our oldest fossils date to roughly 3.5 billion years ago, and consist of bacteria micro fossils. The final eon apart of the Precambrian Era is the Proterozoic eon. During this time, life began to evolve into more complex organisms. The first evidence of life that were once living in the oceans of the Earth were one-celled micro organisms that were capable of photosynthesis. They helped the air and water around the Earth, become full of oxygen.

S&EP - SP6: Constructing explanations and designing solutions

I evaluated information to explain the history of the Precambrian era and form hypotheses. In order to complete the worksheet for this project, much research was required. I needed to search the internet to figure out when the Precambrian era began and when it ended, how long it lasted, the different periods it is divided into, the major events that occurred during the era and its different periods, the climate during this era, the positions of the continents during this period, what types of life lived during this era, and finally the major types of plants present in this era. Once finding the information for each of these topics, I answered the questions on the worksheet using detailed ACE explanations. I constructed an explanation of each topic I researched for the Precambrian era, when I found the needed information by searching sources online and collecting the information using the ACE structure of answering. I designed a solution to a problem when a source I was searching didn't have enough information needed to answer the topic questions. However I solved this problem by researching multiple sources to grasp as much information as I could find on the topic. For example, one website I visited didn't mention anything about plants existing during the Precambrian era. But after researching multiple websites, I finally found a website that gave me all the information I needed on the plants that lived during this era.

Friday, September 8, 2017

The Age of Rocks - 9/10/17

https://upload.wikimedia.org/wikipedia/commons/thumb/a/a0/Cross-section_of_sedimentary_layers.png/500px-Cross-section_of_sedimentary_layers.png
The Geological Time Scale is a record of the life forms and geologic events in Earth's history. The Geological Time Scale includes the age of rocks or the years since the rocks are formed. There are two ways that geologists determine the age of rocks. The Relative age is the age of a rock compared to the ages of other rocks. For example the rock is younger than the rock beneath it. The Absolute age is the number of years since a rock is formed. For example the rock is one million years old. The law of superposition states that in any undisturbed sequence of rocks deposited in layers, the youngest layer is on top and the oldest on bottom, each layer being younger than the one beneath it and older than the one above it. Therefore the older the rock is, the deeper it is in the ground. Another way to determine relative age of rocks is the Cross-Cutting Principle: when "something" cuts across a body of rock, that "something" is younger than the rock it cuts across. 

S&EP - SP7: Engaging in argument from evidence

I use evidence to defend my explanation. I took notes on the age of rocks and fossils providing the power point about how scientists find the age of fossils, as evidence. I formulated evidence based on solid data when I stated that the top layer of rock is younger than the bottom layer of rock, using the fact that the older the rock is, the deeper it is in the ground as evidence. I examined my own understanding in light of the evidence. I used to think that rocks were dated depending on what stage of the Rock Cycle they were in, but because of understanding the information on the power point that my teacher presented in class, now I think that rocks are dated by their layers. I collaborated with my peers in searching for the best explanation. I did some research on the age of rocks and fossils which I discussed with my class and table group. Together we figured out that scientists find the age of fossils depending on how deep the rock is in the ground.


Thursday, August 31, 2017

The Rock Cycle - 9/2/17

http://www.mineralogy4kids.org/sites/default/files/rockCycle_0.jpg
The Rock Cycle is the cycle of processes that rocks in the Earth's crust undergo. The Rock Cycle describes the formation, breakdown, and reformation of rocks. The three main processes that a rock goes through is Igneous rock, Sedimentary rock, and Metamorphic rock. The Igneous rock is formed by cooling of molten magma on the Earth's surface. The Sedimentary rock is formed when sediment is deposited out of air, ice, wind, or when water flows carry these particles in suspension. This sediment is often formed when weathering and erosion break down a rock into loose material. The Metamorphic rock is a result of a transformation of a pre-existing rock. The pre-existing rock is subjected to very high heat and pressure which makes it go through physical and/or chemical changes. Each type of rock is able to transform into the two other rock types. However, there are other steps that the rocks must go through in order to transform from one rock type to another. The other stages of the cycle include becoming magma, soil, or sediment. You may be wondering how the rocks transport from one stage to another, well the rocks may experience erosion, weathering, deposition, lithification, melting, or crystallization when transforming into the different stages of the rock cycle. Rocks typically start as molten rock (magma below ground or lava above ground) which cools and hardens into igneous rock. No matter what rocks start as, they are always able to go through the cycle and make their way back to what they originally were.

S&EP - SP1: Asking questions and defining problems

I formulated testable questions when I discovered what I needed to do in order to complete the worksheet I did in class, about the Rock Cycle. I established what is already known about the Rock Cycle by writing, filling out, and answering questions about the Rock Cycle and how it works, using the online Gizmo. I determined what questions have yet to be answered when I looked back on the information that I collected and saw which of the questions on the worksheet I still needed to answer. I defined constraints and specifications for a solution when I noticed that some of the information on the worksheet I needed to have wasn't actually on the Gizmo. This information that I needed should only be answered by myself, since it was only the basic knowledge of the Rock Cycle I should have. However, I had some trouble on this part because the Rock Cycle is review from sixth grade and I don't quite remember all the processes of the cycle.

Sunday, May 21, 2017

The Environmental Accords 5/21

http://ueamelakasummit2017.mpag.gov.my:8081/uea/uea/images/logo_uea.png

The Urban Environmental Accords are a set of objectives for an urban future. These objectives are set for an urban future that would be "ecologically sustainable, economically dynamic, and socially equitable". As well as these set of objectives are based on existing best practices and applied to issues like energy, waste reduction, urban nature, transportation, and water. The Environmental Accords were created on June 05, 2005. On this date, San Francisco hosted United Nations World Environment Day, during which Mayor Gavin Newsom presented mayors from around the world with this unique opportunity to create the Urban Environmental Accords. Since then, the Urban Environmental Accords have been signed by more than a hundred mayors who have begun applying accord principles in their own cities across the globe. In addition, since then San Francisco has been adopting three Urban Environmental Accords actions per year. All together, there are 21 Environmental Accords. These 21 accords are separated into seven different categories. The seven categories that the Environmental Accords cover are Energy, Waste Reduction, Urban Design, Urban Nature, Transportation, Environmental Health, and Water. Each category contains three different Urban Environmental Accords.

S&EP - SP7: Engaging in argument through evidence

I used evidence to defend my explanation. I created a brochure for my Redesigned Urban Village using the Urban Environmental Accords, providing three Urban Environmental Accords as evidence. For this assignment, I had to create a brochure type document for my Urban Village. I chose three Environmental Accords and listed them down on my brochure. As well as I wrote a paragraph for each of the three Environmental Accords, stating how my Urban Village will reflect and show these Accords in its environment. I formulated evidence based on solid data when I stated that my Urban Village will provide a compost bin and a recycling bin next to every trash can following Environmental Accord #6 using the fact that Accord #6 is to implement "user-friendly" composting and recycling programs as evidence. I examined my own understanding in light of the evidence. I used to think that the 21 Urban Environmental Accords were just about helping to protect the environment generally, but because of reading through the different Environmental Accords for this assignment, now I think that the Urban Environmental Accords are separated by seven specific categories Energy, Waste Reduction, Urban Design, Urban Nature, Transportation, Environmental Health, and Water. I collaborated with my peers in searching for the best explanation. I did some research on the 21 Urban Environmental Accords which I discussed with my table group and elbow partner. Together we figured out all of the different 21 Urban Environmental Accords and how they impact the environment of an Urban Village.

XCC: Cause and Effect

The cause and effect relationship that occurs in the 21 Environmental Accords happens between the specific accord and how it impacts the environment of an Urban Village. The actions of one of the Environmental Accords effects the environment by improving energy, waste reduction, urban design, urban nature, transportation, environmental health, and water. As well as the outcome of each of the Urban Environmental Accords not only benefits the environment, it also impacts an Urban Village by improving quality of life. For example, action #13 is to develop and implement a policy which expands affordable public transportation coverage to within half-a-kilometer of all city residents in ten years. This impacts the environment by encouraging more public transportation to reduce the amount of fossil fuels that are released by individual cars. Less fossil fuels released into the atmosphere, means less pollution in the environment. As well as this action also helps the Urban Village by providing a more affordable public transportation system to the community.

Sunday, May 14, 2017

The Different "Spheres" of the World 5/14

http://assets.openstudy.com/updates/attachments/547f6731e4b03e22bc88fba0-kamibug-1417635919362-capture.png
Humans have impacted the world greatly. Don't be flattered because I don't mean in a beneficial way. What I'm trying to say is that human activities and actions have damaged the Earth's environment. This takes me to the 5 "Spheres" of the world. Earth's system can be separated into five major subsystems; air, land, water, organisms, and ice. These five subsystems are called "spheres". More specifically, they are the atmosphere (air), lithosphere (land), hydrosphere (water), biosphere (living things), and cryosphere (ice). The atmosphere is the layer of gases surrounding a planet. Humans activities effect the atmosphere by causing air pollution in many different ways, including the use of transportation that requires gas, working in factories that give off fossil fuel gases, and using items that give off smoke. The lithosphere is the rigid outer part of the Earth, consisting of the crust and upper mantle. The lithosphere is impacted by humans because of erosion. Natural land cover is disturbed as new cities are built because this new development can result in very high levels of erosion. As well as deforestation to clear land, damages the quality of land. The hydrosphere consists of all the waters on the surface of the Earth, such as lakes, rivers, seas, and oceans. Humans can impact the hydrosphere by creating water pollution. Water pollution occurs when humans let out oils and trash into bodies of water. In addition, humans can redirect the course rivers take make by creating dams. The biosphere is the global ecological system integrating all living things and their relationships. The biosphere is effected by humans when humans cause species to become endangered and go extinct. Humans cause this to happen by clearing out the homes of different species in order to build cities. The final sphere, cryosphere, is the frozen water part of the Earth's system. Climate change is a big impact on the cryosphere and all of the fossil fuels that are let off from humans makes the Earth warmer. The cryosphere protects the Earth from getting too warm, but when the ice melts from global warming, it impacts the affects the entire planet's energy balance.

S&EP - SP7: Engaging in argument through evidence

I used evidence to defend my explanation. I played a playlist of educational games on "Legends of Learning" that dealt with human impact on the Earth and taught me how we can start improving, providing the information that I learned as evidence. I formulated evidence based on solid data when I stated that human activities damage the atmosphere by creating air pollution using my knowledge that gas emissions from transportation mobiles, fossil fuel gases that are given off from human made factories, and smoke that is burned from humans cause air pollution, as evidence. I examined my own understanding in light of the evidence. I used to think that deforestation of areas in order to clear space for cities effected the lithosphere most because of soil erosion that deforestation causes, but because of playing the educational games and learning new information, now I think that deforestation is a huge impact on the biosphere because of the lost of homes of animal species. I collaborated with my peers in searching for the best explanation. I did some research on the different "spheres" of the Earth and how human activities greatly impact them, which I discussed with my class and the people at my table. Together we figured out how humans effect the environment of the Earth and the Earth's "spheres" with our actions.

XCC: Cause and Effect

The cause and effect relationship that occurs in the different "spheres" of the Earth happens between us humans and the well being of the Earth's environment. More specifically, the relationship revolves around the actions and activities humans take in daily life and how this effects the "spheres" of the Earth. For example when humans let out fossil fuels into the atmosphere, this not only affects the atmosphere with air pollution, it also causes the global warming. Global warming is the act of the Earth getting warmer. When the Earth gets warmer, it effects the cryosphere by melting ice. This is important because when the ice melts, it effects the entire planet's energy balance and encourages global warming. Another example of this relationship is when humans cause water polution. When we release oil, trash, and other toxic items into bodies of water, it of course pollutes the water and contaminates it. However, this action also affects the biosphere by killing any species that live in these contaminated bodies of water.

Sunday, May 7, 2017

Acid vs. Base 5/7

http://www.differencebetween.info/sites/default/files/images/1/ph-scale.jpg
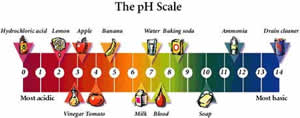
An acid is a chemical substance that neutralizes alkali and is able to dissolve some metals. Acids are usually a sour tasting liquid. You will most likely be able to find acids in foods you eat and drinks you consume. Examples of acidic substances are lemon juice, coffee, or tea. However, these acids aren't very strong, meaning that they aren't harmful and won't be able to burn through metals. A base is a chemical substance that is slippery to the touch and has a bitter taste. You will be able to find bases in cleaning products. Such as soap, baking soda, and ammonia. These products aren't very strong bases either, which is why you are able to use them to clean with no harm done to you. You can measure how acidic or basic a product is by using a pH scale. To use a pH scale, you put some of the product on a piece of litmus paper. If an acid is poured on the paper, it turns the litmus red. If a base is poured on the paper, it turns the litmus a blue color. This means that the more red the litmus paper is after the experiment, the more acidic the substance is. As well as the more acidic a substance is, the lower the pH level is on the scale. For bases, the more blue the litmus paper is, the more basic the substance is. The more basic a product is, the higher the pH level on the scale. You can tell that a product is an acid if the pH level ranges anywhere on the scale from 0 to 6. In contrast, you can tell that a product is a base if the pH level ranges from 8 to 14. In addition, the lower the pH level of an acid and the closer it is to 0, the more concentrated the acid is. The higher the pH level of a base and the closer it is to 14, the more concentrated the base is. You may be thinking, what does it mean if the pH level of a product is at 7? Is there an in between? The answer is no, if a substance has a pH level of 7, this means that the substance is neither an acid or a base. This means that the substance is neutral. An example of a neutral product is water or H2O. 

S&EP - SP7: Engaging in argument from evidence

I used evidence to defend my explanation. I conducted an experiment that tested the pH level of different acidic or basic products and filled out a worksheet about the pH level of acids and bases, providing the results of the experiment as evidence. I formulated evidence based on solid data when I stated that the more red the substance was when it was tested, the more concentrated the acid was using my observation that the lower the numbers got on the pH scale, the more red the substance had to be and the lower the pH level of a substance means that the substance is a stronger acid, as evidence. I examined my own understanding in light of the evidence. I used to think that when a substance had a pH level of 7, it just meant the substance was in between and was both an acid and a base, but because of learning about neutral substances now I think that when the pH level of a substance is 7 that means that it is neither an acid or a base, but a neutral substance. I collaborated with my peers in searching for the best explanation. I did some research on how to use a pH scale to tell if a substance is an acid or a base which I discussed with my class and the people at my table who conducted the experiment with me. Together we figured out that the lower the pH level and the more red a substance is, the more acidic the substance is. As well as the higher the pH level and the more green or blue a substance is, the more basic the substance.

XCC: Patterns

The pattern that occurs with using a pH scale to measure if a substance is acidic or basic, deals with the pH level of the substance and what color it is when tested. I observed this pattern when conducting an experiment in class that allowed me to see how acidic or basic a substance was based on its pH level. During the experiment I saw that after testing out the substances, all the acid products were a pink to reddish color and all of the base products were a green to blue color. When testing an acid product, I noticed that the more red the substance, the lower the pH level of the substance. Which lead me to figure out the the lower the pH level of a substance, the stronger and more concentrated the acid is. As well as the higher the pH level of an acid, the weaker and less concentrated the acid is. In contrast, I noticed an opposite pattern with bases. When testing a base product, I noticed that the more green the substance got, the higher the pH level of the substance on a pH scale. With this information I found that the higher the pH level of a substance, the more concentrated and stronger the base is. In addition, the lower the pH level of a base, the less concentrated and weak the base is.

Sunday, April 30, 2017

Endothermic vs. Exothermic 4/30

http://chembossenergy.weebly.com/uploads/3/7/8/5/37850991/2004728_orig.gif
A chemical reaction can either be Endothermic or Exothermic. This means that the reaction can either absorb energy or release energy. An Endothermic reaction is a chemical reaction in which the solution absorbs energy from its surroundings. In contrast, the opposite of an Endothermic reaction is an Exothermic reaction. An Exothermic reaction is when the solution of a chemical reaction releases energy. This energy that is either absorbed or released is usually, but not always, in the form of heat. Since an Endothermic reaction absorbs heat, the products will have more potential energy than the reactants. This is because the reactants require more energy in order to complete the chemical reaction. In a Exothermic reaction, the products will have less potential energy than the reactants. The reactants of an Exothermic reaction have to release energy in order to complete the chemical reaction. You may be asking, where does the absorbed energy come from in an Endothermic reaction and where does the released energy go in a Exothermic reaction? The simple answer is the surrounding environment. In an Endothermic reaction, the energy comes from the surrounding environment of the chemical reaction. In an Exothermic reaction, the energy is released into the surrounding environment of the chemical reaction. An easy way to tell the difference between these reactions is by measuring the temperature. Since the energy usually comes in the form of heat, the temperature of a chemical reaction will change depending if it is Endothermic or Exothermic. In an Endothermic reaction, the temperature will decrease and the product will be a lower temperature than the reactants. In an Exothermic reaction, the temperature will increase and the product will be a higher temperature than the reactants.

S&EP - SP7: Engaging in argument from evidence

I used evidence to defend my explanation. I answered a worksheet in class about Endothermic and Exothermic reactions providing the examples and models on a website that was given to my classmates and I to use, as evidence. I formulated evidence based on solid data when I stated that the products of an Endothermic reaction is colder or a lower temperature than the reactants of the chemical reaction using the fact that energy (usually in the form of heat) from the surrounding environment is absorbed into the reaction and trapped inside the bonds of the molecules in an Endothermic reaction, making the surrounding environment colder, as evidence. I examined my own understanding in light of the evidence. I used to think that the temperature of the products in an Exothermic reaction would be cooler and at a lower temperature than the reactants because the heat energy was being released from the reactants, but because of learning that the energy is released into the surrounding environment of the chemical reaction, now I think that releasing the heat energy rises the temperature of the chemical reaction. I collaborated with my peers in searching for the best explanation. I did some research on Endothermic and Exothermic reactions and how they occur which I discussed with my class and table group. Together we figured out that an Endothermic reaction absorbs energy and an Exothermic reaction releases energy.

XCC: Cause and Effect

The cause and effect relationship that occurs in Endothermic and Exothermic reactions is between the reactants and products of the chemical reaction. The amount of potential energy that is in the product depends if the chemical reaction is an Endothermic reaction or Exothermic reaction. If the chemical reaction is an Endothermic reaction, the product will have more potential energy than the reactants. This is because the reactants of the chemical reaction absorb energy from the surrounding environment of the chemical reaction in order to break the bonds. If the reaction is an Exothermic reaction, the product will have less potential energy than the reactants. This is because the reactants of the chemical reaction release energy into the surrounding environment of the chemical reaction in order to form new bonds. In addition, the temperature of the product in the chemical reaction depends if the reaction is Endothermic or Exothermic as well. If the chemical reaction is an Endothermic reaction, the product is colder and at a lower temperature than the reactants. The temperature of the chemical reaction drops because the reactants absorb heat energy from the surrounding environment, making the surrounding environment of the chemical reaction colder. If the chemical reaction is an Exothermic reaction, the product is warmer and at a higher temperature than the reactants. The temperature of the chemical reaction rises because the reactants release heat energy into the surrounding environment, making the surrounding environment of the chemical reaction warmer.